Solidigm™ D5-P5430 Product Brief
Reduce TCO for your Mainstream and Read-Intensive Workloads
Data is growing at a rapid pace, testing the limits of data centers and storage scalability. Modern, data-intensive workloads and use cases such as AI, ML, content-delivery networks (CDNs), object-based storage, and data analytics require massive amounts of data to be stored efficiently and accessed at speed. These requirements have historically been viewed as a tradeoff between performance and capacity: select SSDs when an application demands performance and choose HDDs when an application prioritizes capacity.
For many mainstream and read-intensive workloads, the Solidigm™ D5-P5430, with its blend of hyper-dense, affordable storage and high throughput, renders that tradeoff moot. The D5-P5430 delivers TLC-like read performance with massive lifetime writes, on QLC economics, leading to reduced total cost of ownership (TCO) and improved sustainability of data center and edge infrastructures. Available in a broad range of form factors and capacities up to 30.72 TB, the D5-P5430 can be deployed in a wide array of 1U and 2U configurations.

Efficiently scale capacity and performance
Mainstream workloads and use cases such as general purpose servers, object-based storage, and online analytical processing tend to cluster in the high-read, low-write mix ratio (e.g., 80/20), and because the mix of writes is relatively low, drives with sufficient petabytes written (PBW) can service these workloads. Read-intensive workloads such as CDNs, data pipelines, VoD services, and large, sequential databases cluster in the mostly-read-with-occasional-writes ratio (e.g., 90/10 or higher), and, like their mainstream counterparts, value high throughput.
Engineered to deliver TLC-equivalent read performance and massive petabytes written, the D5-P5430 supports both mainstream and read-intensive workloads by providing unique density, efficiency, and serviceability advantages without sacrificing performance.
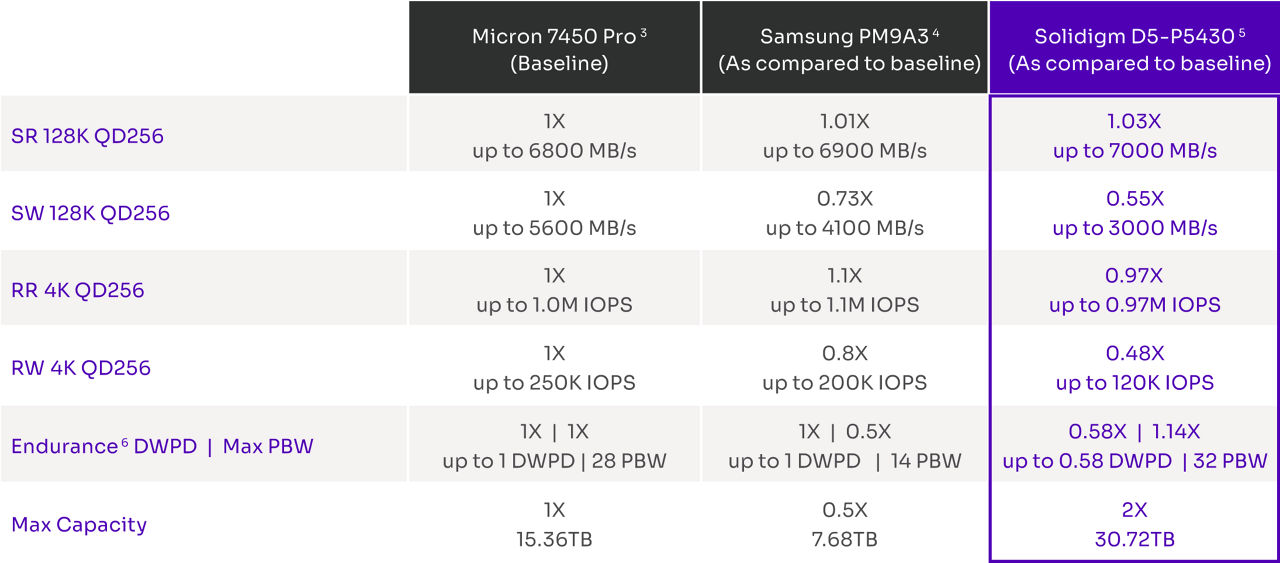
When compared to widely adopted PCIe TLC SSDs, the D5-P5430 can support up to 4x more capacity in the same space [1] while delivering equivalent read performance and up to 14% higher lifetime writes. [2]

Table 1: Competitive Spec Comparision of Solidigm D5-P5430 to Micron and Samsung SSDs
Reduce total cost of ownership & increase storage density while improving energy efficiency
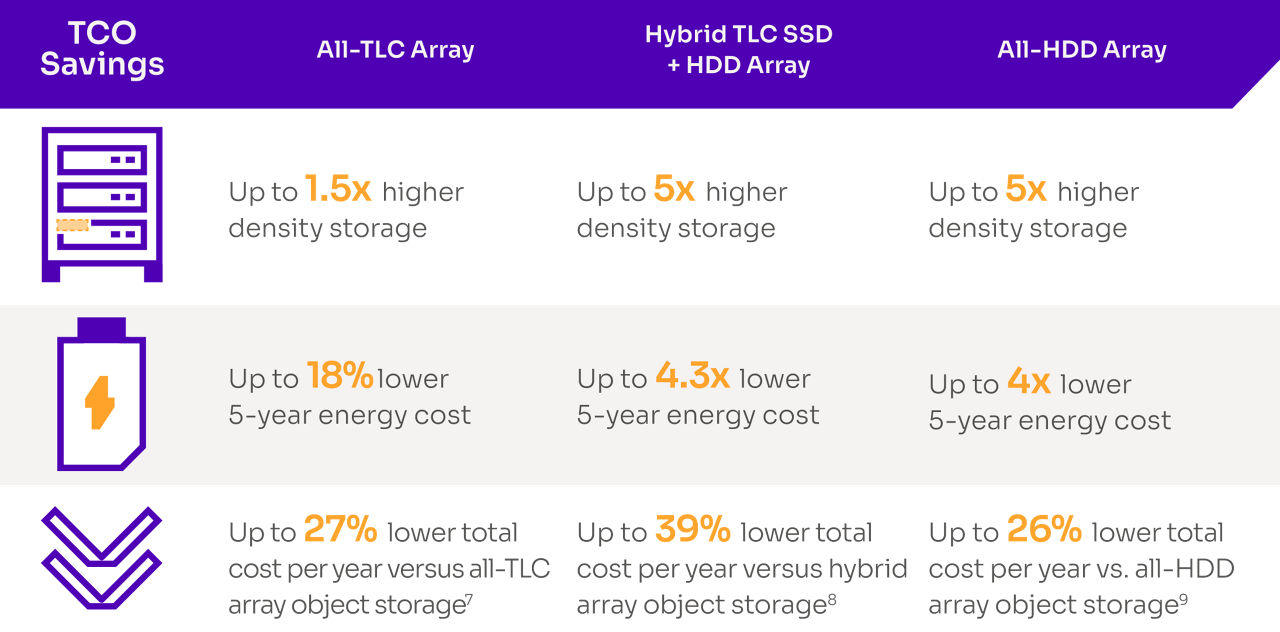
With its unique combination of density and optimal performance for mainstream and read-intensive workloads, the D5-P5430 can open TCO savings opportunities across a range of legacy configurations such as all-TLC SSDs, hybrid, and all-HDDs arrays:

Table 2: TCO savings with D5-P5430 vs Legacy Configurations
Sustainability as a by-product of TCO not only benefits bottom-lines, but it also addresses concerns on the minds of consumers, regulators, and communities. It is estimated that data centers are on a trajectory to consume 3 to 13% of global power by 2030, and with 85 to 90% of data center storage still on hard disk drives, high density NAND SSDs present a meaningful sustainability opportunity. [10,11]
The higher capacity of the D5-P5430 coupled with effective performance can deliver up to 5x higher density storage, 4.3x lower 5-year energy consumption, and 3.8x fewer drives to disposition at end-of-life compared to a hybrid array. [12]
Bottom line, the D5-P5430 delivers more sustainable storage, versus lower-density, less efficient storage.
Deploy with confidence in an array of configurations
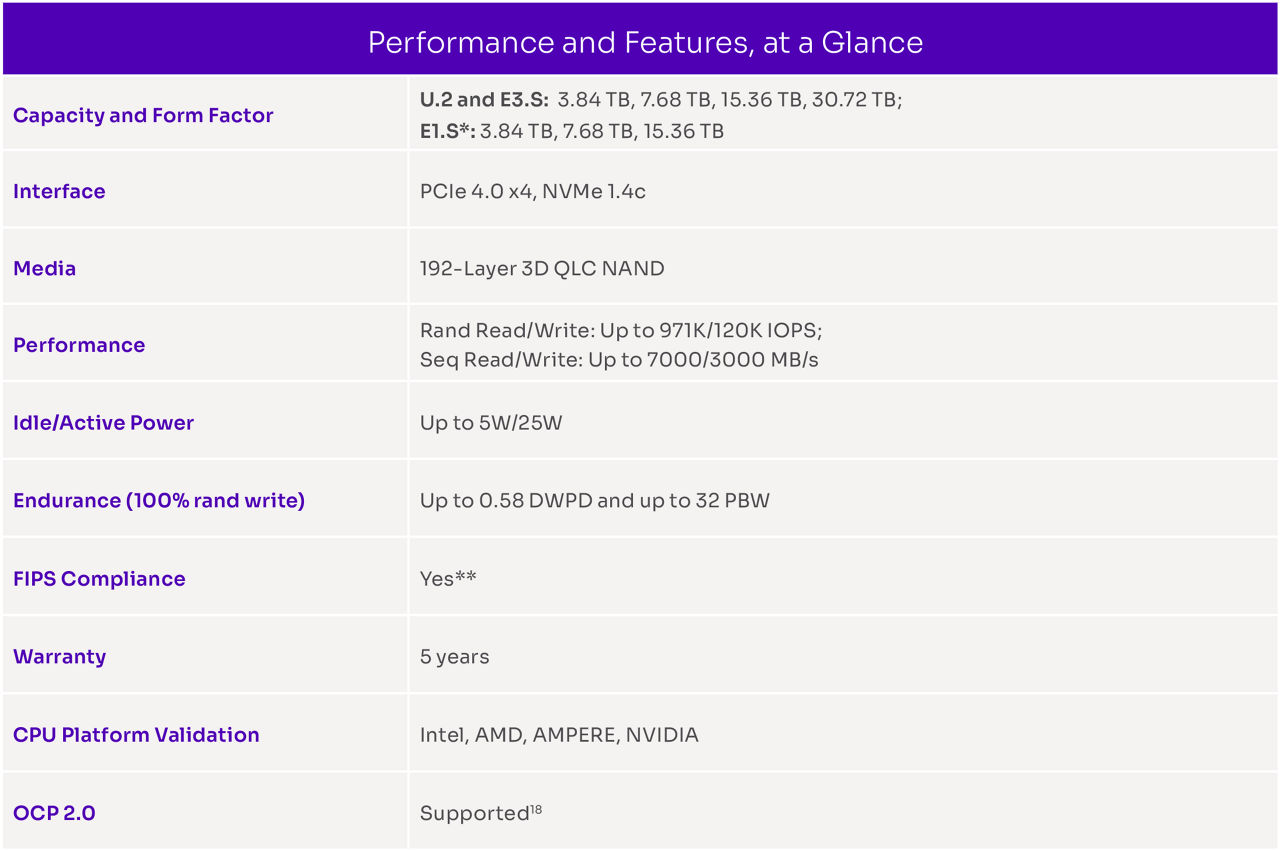
Building on the Solidigm product line of D5 Series SSDs, the D5-P5430 offers a class-leading range of form factors (U.2, E3.S, E1.S) and capacities (3.84 TB to 30.72 TB), enabling a broad range of configurations. [13] For those looking to preserve chassis infrastructure but achieve better density, the D5-P5430 is available in U.2. However, some customers may want to realize even more benefits from the D5-P5430 and move away from the limitations imposed by legacy form factors by transitioning to EDSFF SSDs.
Adapting SSD form factors that evolved outside data centers presents limitations. For instance, U.2 was inspired by HDDs and M.2 had its beginnings in notebook PCs before they were adapted to data center use. EDSFF marked the first time a storage form factor was built from the ground-up for NAND and optimized to address key data center storage challenges and needs, such as serviceability, cooling, space efficiency, signal integrity, and scalability. The transition from legacy to EDSFF is well underway, with estimates that almost half of PB shipped into the data center will be EDSFF by 2026. [14]
The D5-P5430 comes in both E3.S and E1.S form factors. The E3.S form factor is targeted to displace U.2 drives in 2U density-optimized servers for higher power and performance, as well as increased flexibility to mix devices. E1.S has advantages over U.2 and M.2 in 1U performance-optimized servers for its ability to pack more IOPS in the same space and thermal efficiency to either run faster processors or decrease cooling cost.
The D5-P5430 also offers new feature sets that are essential to building modern data centers, such as Secure boot, Opal (data at rest security), FIPS 130-2 Level 2, industry-leading data reliability, and zero SDC errors detected in over 6 million years of simulated operational life. [15,16] That means you can deploy with confidence, knowing that the D5-P5430 is validated and tested beyond industry standards and common practices, with data integrity built in. [17]

Table 3: D5-P5430 performance and features
All information provided is subject to change at any time, without notice. Solidigm™ may make changes to manufacturing life cycle, specifications, and product descriptions at any time, without notice. The information herein is provided “as-is” and Solidigm does not make any representations or warranties whatsoever regarding accuracy of the information, nor on the product features, availability, functionality, or compatibility of the products listed. Please contact system vendor for more information on specific products or systems.
Performance results are based on testing as of dates shown in configurations and may not reflect all publicly available updates. See backup for configuration details. No product or component can be absolutely secure.
Performance varies by use, configuration and other factors.
Refer to the spec sheet for formal definitions of product properties and features. Nothing herein is intended to create any express or implied warranty, including without limitation, the implied warranties of merchantability, fitness for a particular purpose, and non-infringement, or any warranty arising from course of performance, course of dealing, or usage in trade.
Tests document performance of components on a particular test, in specific systems. Differences in hardware, software, or configuration will affect actual performance. Consult other sources of information to evaluate performance as you consider your purchase.
Solidigm optimizations, for Solidigm compilers or other products, may not provide optimized performance to the same degree for non-Solidigm products. Solidigm technologies may require enabled hardware, software, or service activation.
Your costs and results may vary.
Solidigm does not control or audit third-party data. You should consult other sources to evaluate accuracy.
Some results have been estimated or simulated using internal Solidigm analysis or architecture simulation or modeling, and provided to you for information purposes only. Any differences in your system hardware, software or configuration may affect your actual performance. All product plans, roadmaps, specifications, and product descriptions are subject to change without notice.
The products described in this document may contain design defects or errors known as “errata,” which may cause the product to deviate from published specifications. Current characterized errata are available on request.
Contact your Solidigm representative or your distributor to obtain the latest specifications before placing your product order.
For copies of this document, documents that are referenced within, or other Solidigm literature, please contact your Solidigm representative.
All products, computer systems, dates, and figures specified are preliminary based on current expectations, and are subject to change without notice.
Product labels may differ.
* Broad availability Q4 '23
** Certification in process.
© Solidigm. “Solidigm” is a trademark of SK hynix NAND Product Solutions Corp (d/b/a Solidigm).Other names and brands may be claimed as the property of others
[1] Maximum 48 E3.S drives and 24 U.2 drives per 2U chassis. U.2 vs. U.2-based – 15.36TB Micron 7450 Pro yields 15.36 TB x 24 = 368.64 TB while 30.72 TB D5-P5430 yields 30.72 TB x 24 = 737.28 TB resulting in D5-P5430 supporting 2X more capacity per 2U. E3.S vs. U.2-based – 15.36 TB U.2 Micron 7450 Pro yields 15.36T B x 24 = 368.64 TB while 30.72TB D5-P5430 yields 30.72TB x 48 = 1474.56TB resulting in D5-P5430 supporting 4X more capacity per 2U.
[2] Comparing maximum capacity 30.72 TB Solidigm D5-P5430 with 7000MB/s SR bandwidth, 934.5K RR IOPS and 31.92PBW to maximum capacity 15.36TB Micron 7450 Pro with 6800MB/s SR bandwidth, 1000K RR IOPS and estimated 28PBW.
[3] Source – Micron. Performance and PBW from highest capacity drive available. (Micron)
[4] Source – Samsung. Performance and PBW from highest capacity drive available. (Samsung)
[5] Source – Solidigm. D5-P5430 preliminary product specifications and current 5 quarter roadmap.
[6] Source – Solidigm. Using 100% 16K RW for D5-P5336 and 100% 4K RW for D5-P5430. Footnotes 3 and 4 for others.
[7] Comparing TCO of a 30.72TB Solidigm™ D5-P5430 with 7000MBs throughput, 25W average active power, 5W idle power vs a 15.36TB (highest capacity available) Micron 7450 (datasheet) with 6800 MB/s throughput, 20W average active write power, 5W idle power. Assumes 42U rack capacity, 34U available for storage, 2U servers @ 24x U.3 TLC and 24x U.2 P5430 drives per server. Calculated duty cycles to deliver equivalent throughput per TB: 20% for TLC array, 38.9% for P5430 solution. RAID1 mirroring and 5-year refresh used for both. Key common cost assumptions: Power Cost = $0.15/KWHr, PUE factor = 1.60, Empty Rack Purchase Cost = $1,200, System Cost = $10,000, Rack Cost for Deployment Term = $171,200. Calculations based on Solidigm TCO estimations as of March 2023 using internal Solidigm TCO estimator tool.
[8] Comparing TCO of a 30.72TB Solidigm™ D5-P5430 with 7000MBs throughput, 25W average active power, 5W idle power vs a hybrid system using CAPACITY – Seagate EXOS X20 18TB HDD ST18000NM003D (datasheet) 18TB, throughput calculated to 500 MB/s; 9.4W average active power, 5.4W idle power; CACHE – 15.36TB Micron 7450 (datasheet) with 6800 MB/s throughput, 20W average active write power, 5W idle power. Assumes 42U rack capacity, 34U available for storage, 2U servers @ 22x 2.5” HDDs (capacity) and 2x U.2 SSDs (cache) vs 36x E3.S P5430 SSDs (capacity) per server, respectively. Hybrid solution overprovisioned to 70% capacity utilization to meet customer SLAs. Hybrid refresh cycle = 4 years. Calculated duty cycles to deliver equivalent throughput per TB: 14% for Hybrid array, 3.5% for P5430 solution. RAID 1 mirroring used for P5430; Hybrid set for Hadoop triplication. Key common cost assumptions: Power Cost = $0.15/KWHr, PUE factor = 1.60, Empty Rack Purchase Cost = $1,200, System Cost = $10,000, Rack Cost for Deployment Term = $171,200. Calculations based on Solidigm TCO estimations as of March 2023 using internal Solidigm TCO estimator tool.
[9] Comparing TCO of a 30.72TB Solidigm™ D5-P5430 with 7000MBs throughput, 25W average active power, 5W idle power vs a Seagate EXOS X20 18TB HDD ST18000NM003D (datasheet) 18TB, throughput calculated to 500 MB/s; 9.4W average active power, 5.4W idle power; assumes 42U rack capacity, 34U available for storage, 2U servers @ 24x 2.5” HDDs and 36x E3.S P5430 SSDs per server, respectively. All-HDD solution overprovisioned to 70% capacity utilization to meet customer SLAs. HDD refresh cycle = 4 years. Calculated duty cycles to deliver equivalent throughput per TB: 14% for HDD array, 3.5% for P5430 solution. RAID1 mirroring used for P5430; HDD set for Hadoop triplication. Key common cost assumptions: Power Cost = $0.15/KWHr, PUE factor = 1.60, Empty Rack Purchase Cost = $1,200, System Cost = $10,000, Rack Cost for Deployment Term = $171,200. Calculations based on Solidigm TCO estimations as of March 2023 using internal Solidigm TCO estimator tool.
[10] As presented in Meta keynote at OCP Global Summit 2022.
[11] Source – Solidigm internal analysis and general consensus of industry analyst estimates
[12] Comparing TCO of a 30.72TB Solidigm™ D5-P5430 with 7000MBs throughput, 25W average active power, 5W idle power vs a hybrid system using CAPACITY – Seagate EXOS X20 18TB HDD ST18000NM003D (datasheet) 18TB ,throughput calculated to 500 MB/s; 9.4W average active power, 5.4W idle power; CACHE – 15.36TB Micron 7450 (datasheet) with 6800 MB/s throughput, 20W average active write power, 5W idle power. Assumes 42U rack capacity, 34U available for storage, 2U servers @ 22x HDDs (capacity) and 2x SSDs (cache) vs 36x P5430 SSDs (capacity) per server, respectively. Rack footprint: Hybrid = 5 total racks, P5430 = 1 total rack. 5-year energy costs for Hybrid = $91,178, P5430 =$22,986. Drives per server: Hybrid = 1819 drives, P5430 = 480. Hybrid solution overprovisioned to 70% capacity utilization to meet customer SLAs. Hybrid refresh cycle = 4 years. Calculated duty cycles to deliver equivalent throughput per TB: 14% for Hybrid array, 3.5% for P5430 solution. RAID 1 mirroring used for P5430; Hybrid set for Hadoop triplication. Key common cost assumptions: Power Cost = $0.15/KWHr, PUE factor = 1.60, Empty Rack Purchase Cost = $1,200, System Cost = $10,000, Rack Cost for Deployment Term =$171,200. Calculations based on Solidigm TCO estimations as of March 2023 using internal Solidigm TCO estimator tool.
[13] Comparing Kioxia CD6-R available in U.2 960GB to 15.36TB, Micron 7450 Pro available in U.2 960GB to 15.36TB and E1.S 960GB to 7.68TB, Samsung PM9A3 available in U.2 960GB to 7.68TB and, Solidigm D5-P5430 available or soon to be available in U.2 7.68 to 30.72TB and E1.S 3.84TB to 15.36TB and E3.S in 3.84 to 30.72TB. Solidigm D5-P5430 has higher max capacities for U.2 and E1.S and is only in class supporting E3.S form factor.
[14] Source - Storage Review: The Future of SSD Form Factors” and hyperlink storage review.
[15] Enhanced Power Loss Imminent – Designed-in firmware check to validate data is saved accurately upon power restoration. Unclear if others provide this additional firmware check. Robust End-to-End Data Protection – Built-in redundancy where both ECC and CRC can be active at the same time. Protecting all critical storage arrays within the controller – instruction cache, data cache, indirection buffers and phy buffers. ECC coverage of SRAM to over 99% of array is among the highest in the industry.
[16] Solidigm drives are tested at the neutron source at Los Alamos National Labs to measure Silent Data Corruption susceptibility to 1E-23 and modeled to 1E-25. Test prefills drives with a certain data pattern. Next, the neutron beam is focused on the center of the drive controller while IO commands are continuously issued and checked for accuracy. If the drive fails and hangs/bricks, the test script powers down the drives and the neutron beam. The drive is subsequently rebooted, and data integrity is checked to analyze the cause of failure. SDC can be observed during run time causing a power down command or after reboot if the neutron beam has hit the control logic hanging the drive as a result of inflight data corruption. Because drives go into a disable logical (brick) state when they cannot guarantee data integrity, brick AFR is used as the measure of error handling effectiveness. Solidigm drives have used this testing procedure across 4 generations. Cumulative testing time across generations is the equivalent of over 6M years of operational life in which zero SDC errors have been detected. The most recent testing used the Solidigm D5-P5520 drives which served as a proxy for the Solidigm D5-P5430 drives since they share the same controller and similar firmware. Competitor drives tested were the Samsung 983 ZET, Samsung PM9A3, Samsung PM1733, Micron 7400, Micron 7450, Kioxia XD6, Toshiba XD5 and, WD SN840.
[17] Uncorrectable Bit Error Rate (UBER) - tested to 10X higher than JEDEC specification. Solidigm drives are tested to 1E-17 under full range of conditions and cycle counts throughout the life of the drive which is 10X higher than 1E-16 specified in JEDEC – Solid State Drive Requirements and Endurance Test Method (JESD218). https://www.jedec.org/standards-documents/focus/flash/solid-state-drives. Silent Data Corruption (SDC) - modeled to 1E-25. Typical Reliability Demonstration Test involves 1K drives for 1K hours to model levels down to 1E-18. Solidigm drives are tested at the neutron source at Los Alamos National Labs to measure SDC susceptibility to 1E-23 with modeling to 1E-25.
[18] A majority of OCP 2.0 requirements and features are supported on the D5-P5430. See D5-P5430 Datasheet for Exceptions and Modifications.